 Lucas Oliveira
Stop drowning in vanity metrics. These five numbers (CAC, LTV, MRR, cash burn, and NPS) give you a complete health check in under 10 minutes every Monday. Learn how to track them without a data team, spot trouble early, and decide when to DIY vs hire.
Your bank balance is not a dashboard. Neither is a spreadsheet of 87 KPIs that nobody looks at.
Most founders check revenue when things feel slow and glance at expenses when cash gets tight. They react. They do not measure. That is not running a business. That is guessing.
The founders who scale predictably all have one thing in common: they know their numbers cold. Not once a quarter. Every week. And not every number: just the five that actually matter.
You need vanity metrics vs real metrics sorted out on day one. Total signups, page views, app downloads. Those numbers look good on a pitch deck but tell you nothing about unit economics or whether you are about to run out of cash. A weekly 10-minute scorecard beats a monthly 50-metric dashboard every time.
Here are the five numbers to pull every Monday. No more, no less.
The Five Numbers That Matter
1. Customer Acquisition Cost (CAC)
Total sales and marketing spend for the week divided by the number of new paying customers. That is it. If you spent $5,000 on ads, $2,000 on a sales tool, and closed 10 customers, your CAC is $700.
The benchmark: keep payback under 12 months. For a subscription business, that means if your average customer pays $100 per month, you need CAC below $1,200. The median CAC in 2026 sits around $1,200 per customer across industries, according to data from Magnetic’s tracking benchmarks.
If your CAC spikes and your LTV does not follow, you are buying bad customers. Stop the spend, fix the offer, or tighten your targeting.
2. Lifetime Value (LTV)
Average revenue per customer over the entire relationship. For a SaaS product with $50/month and a 24-month average retention, LTV is $1,200.
The ratio you need: LTV:CAC ≥ 3:1. Below 3:1 means you are spending too much to acquire customers relative to what they are worth. Above 5:1 might mean you are under-investing in growth.
This ratio is the single most watched number in boardrooms. IFS, the industrial AI software company, reported a net retention rate of 114% in their FY2025 results: meaning existing customers spent 14% more year over year. That expansion drives LTV up without increasing CAC.
3. Monthly Recurring Revenue (MRR)
Core recurring revenue, normalized to a monthly figure. Do not track total revenue alone. A one-time project can fool you. Track week-over-week MRR growth.
IFS also posted 23% year-over-year ARR growth in 2025, a leading indicator that their go-to-market works. If your MRR growth decelerates for two consecutive weeks, investigate pricing, sales velocity, or churn before it compounds.
Pull this number from Stripe, Chargebee, or your billing system. It is the first thing investors ask for.
4. Cash Burn
Net cash outflow per week. Average weekly expenses minus weekly revenue. Divide your cash on hand by that burn to get runway in weeks.
Healthy is 12+ weeks. Below 8 is a warning. Below 4 is an emergency. That is not a suggestion: it is the threshold that determines whether you can make payroll without fundraising.
One $8M ARR Series A SaaS company reviewed its five numbers weekly. One week, net new ARR slipped from $180K to $140K even though pipeline coverage looked fine. The cause: a customer had quietly contracted. The fix: a weekly contraction review owned by customer success. That would have been invisible on a monthly P&L.
5. Net Promoter Score (NPS)
A single question: “How likely are you to recommend us?” Score from 0 to 10, with detractors (0-6), passives (7-8), and promoters (9-10). Track the weekly trend, not the absolute number.
A sudden drop in NPS is an early warning of churn. It catches problems weeks before cancellation. Aim for a score above 30 for B2B, above 50 for consumer. If you see a two-week decline, investigate immediately.
These five numbers are your weekly metrics for founders. They cover growth (MRR), efficiency (CAC, LTV), survival (burn), and loyalty (NPS). Everything else is noise.
Getting the Data Without a Data Scientist
You do not need a data team. You need a spreadsheet and 15 minutes.
Tools like Stripe, QuickBooks, or Xero auto-pull MRR and cash burn. HubSpot or a simple CRM tracks CAC and pipeline. NPS can be a weekly survey with 5 questions sent via Typeform or Google Forms.
A Google Sheet with conditional formatting costs nothing and works up to $5M in revenue. Set up columns for this week’s number, last week’s number, target, and a green/yellow/red status. A glance should take 30 seconds.
If you need more automation, platforms like Baremetrics or ChartMogul auto-pull MRR, churn, and ARPU from Stripe with clear burn rate charts. They cost $200 to $1,500 per month but save hours.
For a unified view, Google Looker Studio connects all these sources for free. You can use it to build a correct tracking setup in an afternoon.
The key is consistency. Same time, same place, every Monday. No skipping.
Red Flags: When Your Metrics Signal Trouble
Even with the right numbers, founders fall into three common startup metrics mistakes.
Changing definitions. If you adjust how you calculate CAC or MRR mid-stream, you lose the ability to compare week over week. Pick one formula and stick with it for at least a quarter.
A CAC spike without LTV improvement. That means you are acquiring customers who do not stick. The 2026 median CAC is $1,200, but if your payback period stretches past 12 months, you are shrinking, not growing.
Ignoring churn until it is too late. Churn is a lagging indicator. Weekly NPS drop is a leading one. If you see a dip, investigate the behavior before the cancellation conversation: look at product usage frequency, onboarding completion, or support ticket aging.
One more: mixing cash flow and accrual revenue in the same chart. Cash flow tells you if you can pay bills. Accrual tells you if you are profitable. They are different stories. Keep them separate.
DIY vs. Hire: What a Proper Weekly Review Actually Costs
For most businesses under $5M, a DIY vs hire for startup metrics tracking decision is easy: start with DIY.
DIY takes 15 minutes a week on a spreadsheet. The risk is errors, missed trends, and the temptation to skip weeks. It requires discipline. If you have it, you are fine.
The next step is a tool like Baremetrics or ChartMogul at $200 to $1,500 per month. These add automated data pulls, trend analysis, and anomaly alerts. They are worth it if you are scaling fast or have multiple revenue streams.
Above $5M revenue, consider a fractional CFO or a deeper tool like Tableau for data blending. The cost runs $2,000 to $5,000 per month, but the savings from catching one bad campaign or pricing mistake can pay for a year.
If you already have the right tools but your tracking is lying to you, check your server-side tracking setup to ensure your data is clean.
The 15-Minute Monday Ritual
Pick your tool. Set the same block every Monday morning. Pull the five numbers.
For each: this week’s number, last week’s number, the target, and a color (green/yellow/red). Red for two weeks triggers a structured response: owner, root cause, countermeasure, due date.
Record the % change and a one-sentence action plan. Then assign owners. That is it. The numbers drive decisions. They do not sit in a report.
The difference between founders who raise fast and those who stall often comes down to this: the ones who raise can explain their unit economics. They know their burn rate. They are not flying blind.
You do not need to track everything. You need to track the right things.
Now go set up that sheet.
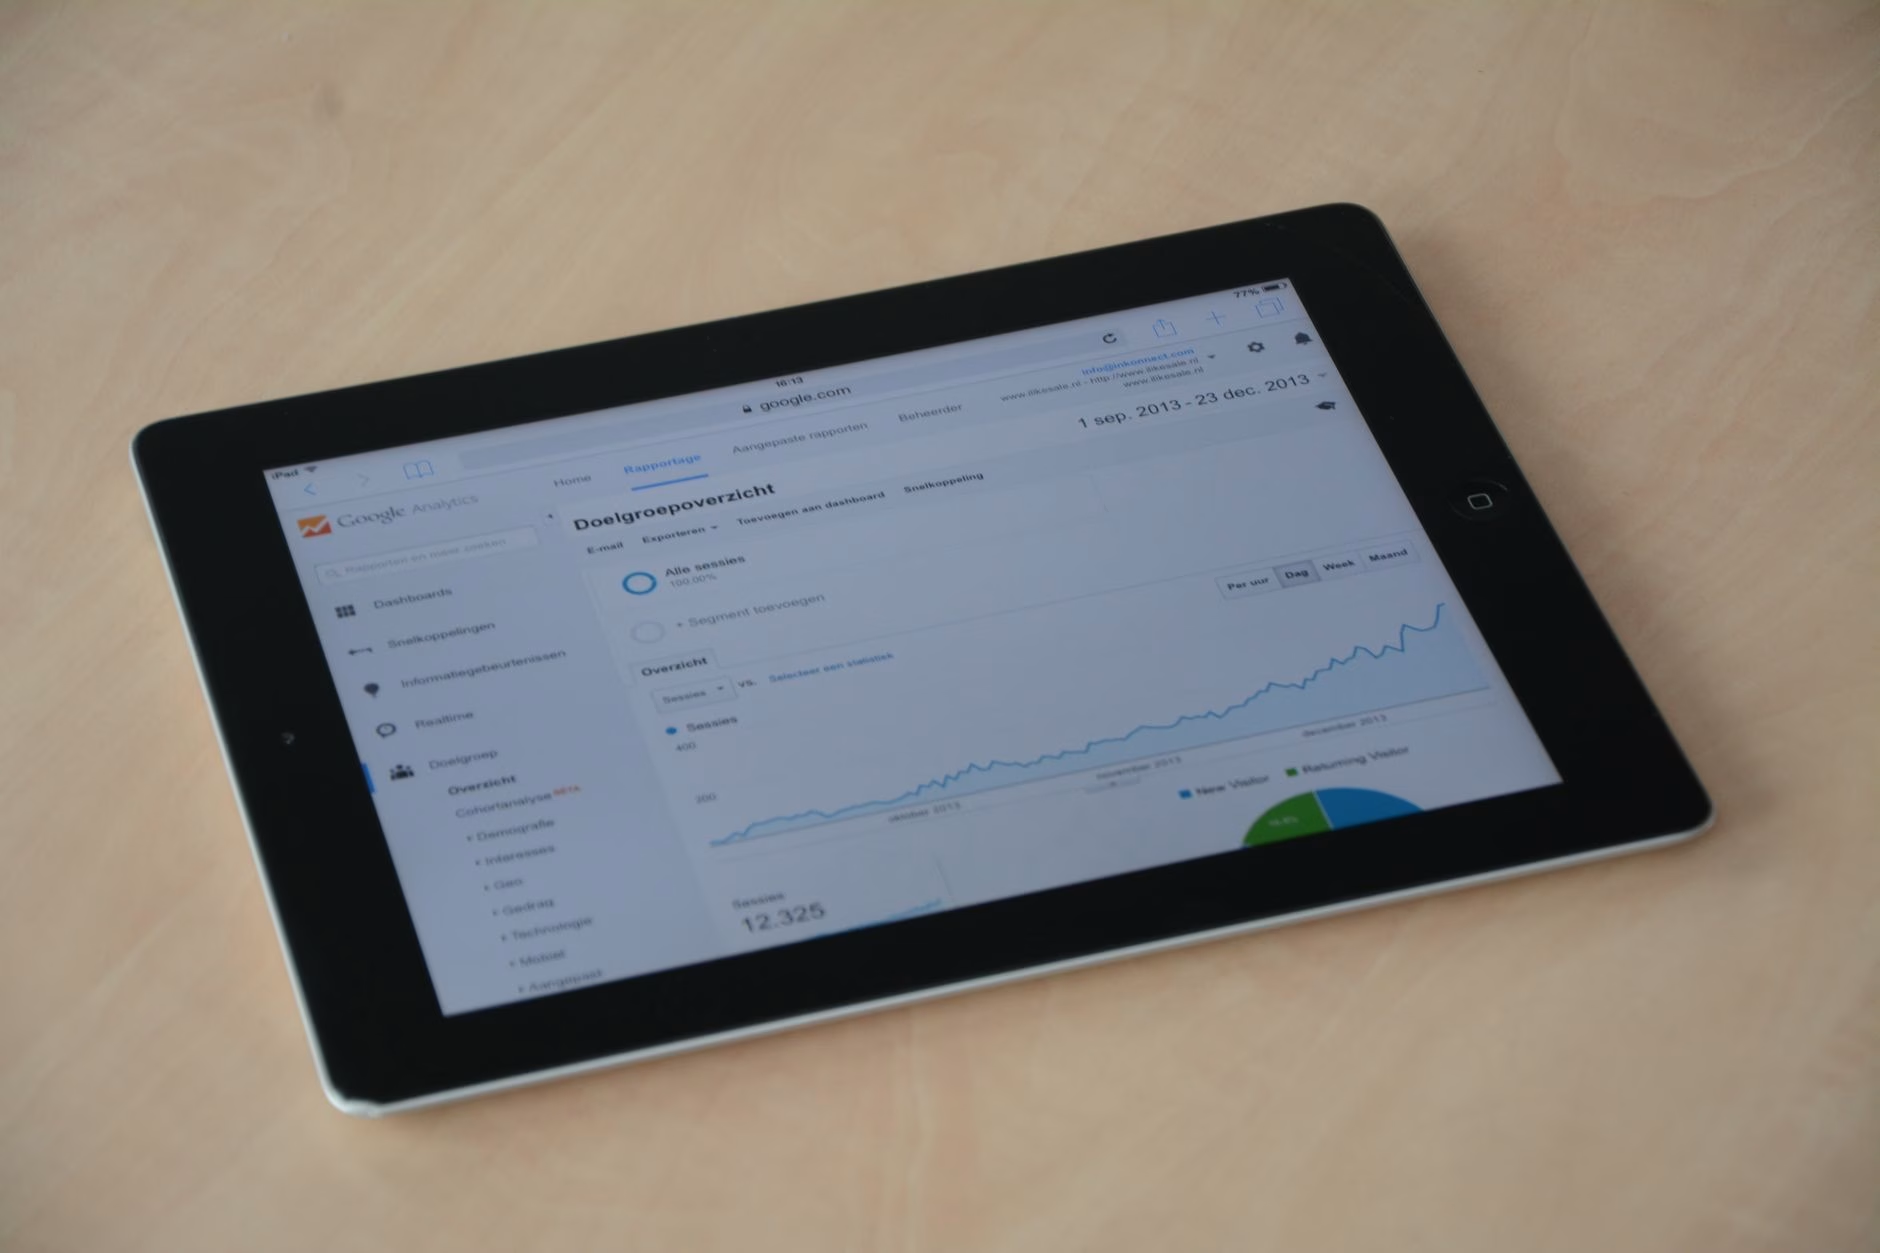
Cover photo by Rostislav Uzunov on Pexels.
Frequently Asked Questions
How long does it take to review the five weekly metrics? +
About 10 to 15 minutes. Pull the numbers from your tools, update the scorecard, note any red flags, and assign actions. Consistency matters more than depth.
What if I don't have a data team to set up tracking? +
You don't need one. Stripe and QuickBooks auto-pull revenue and burn. A free HubSpot CRM tracks CAC. Google Sheets with conditional formatting is enough for businesses under $5M. Link them to Looker Studio for a free dashboard.
My NPS score fluctuates wildly week to week. Should I still track it? +
Yes, but look at the trend, not the absolute number. A two-week decline matters; a one-week dip from a small sample size is noise. Keep the survey simple and consistent. Use a rolling 4-week average if needed.